

[ADM.L – Admiral Group] Barriers to scale; moats vs. revenue models

“I have always been attracted to the low cost operator in any business and, when you can find a combination of (i) an extremely large business, (ii) a more or less homogenous product, and (iii) a very large gap in operating costs between the low cost operator and all of the other companies in the industry, you have a really attractive investment situation. That situation prevailed twenty five years ago when I first became interested in the company, and it still prevails.”
Warren Buffett (in a letter to one of GEICO’s officers, dated July 22, 1976)
Two distinguishing features of auto insurance are that it is: 1/ short-tail, meaning that a claim is known soon after the accident occurs…unlike, say, asbestos, the liability doesn’t lurk hidden on the balance sheet for decades before manifesting1; and 2/ granular, meaning each loss event is relatively small and the law of large numbers is more applicable compared to something like coastal commercial property. An auto carrier with national scale is unlikely to have its balance sheet torpedoed by a handful of loss events. Claims severity (auto repair costs, bodily injury inflation, and legal costs), while inflating at 7%-9%/year as more sophisticated technology gives rise to greater “bent metal” claims cost2, is nevertheless predictable and range-bound development and can be synchronized with pricing to maintain profitability. Over a large population, claims patterns are risky but not really uncertain.
But the granular, short-tail nature of the auto risk also results in more uniform policies and transparent pricing, which renders it a price-driven commodity that requires a competitively advantaged cost structure to profitably underwrite.
The most consistently profitable US auto carriers – Progressive (the #3 player with 11% market share by premiums) and GEICO (#2; 13%) – achieve cost supremacy through scale. At a time when most insurers distributed through independent agents, GEICO heaped premiums atop fixed marketing costs to achieve unassailable cost leadership first among low risk government employees and then among the broader population.
Brand advertising and size also confer benefits online. Due to its high unaided brand awareness – which soared from ~15% in 2000 to nearly 60% by 2011 and is almost certainly higher today – Progressive not only enjoys more direct searches but is almost certainly assigned a higher Quality Score by Google, which means it can underbid less well-known peers for the same keywords. And relative to smaller underwriters, GEICO and Progressive have more data with which to better segment customers, price risk, and market to consumers.
Having a culture that treats customers well and values technology reinforces scale advantages. All else equal, retention rates matter a great deal more when customer acquisition costs are fixed than when they are variable. If a customer churns off in year 1 due to poor claims experience, an underwriter who relies on brand marketing and therefore bears the entire acquisition cost upfront will be much worse off than one who pays independent agents a percent of premiums. Progressive might report, say, a 130% combined ratio in year one (combined ratio = losses paid + underwriting expenses + customer acquisition costs divided into net premiums) but still generate underwriting profits over a policyholder’s lifetime, assuming 80%-85% combineds for that policyholder in subsequent years.
Moreover, while I’m sure every auto underwriter insists that assiduous claims management, customer segmentation, and pricing is deeply ingrained in their DNA, the ones who really mean it prioritize technology and data. Progressive is widely reputed to be the most tech-savvy/statistically driven carrier in the industry. In 1998 the company pioneered usage-based insurance (using driving behavior collected from a telematics device or a smartphone app to inform pricing and segmentation3) and claims to have more driving data than any other carrier, data that can be used, for instance, to offer lower prices to responsible drivers. While most insurers outsourced marketing and considered every dollar of ad spend interchangeable, Progressive treated marketing as a core competency, buying all its ads in-house, negotiating directly with publishers and media networks, designing its own marketing content, and assiduously measuring return on ad spend (for instance, leveraging Big Data for multi-touch attribution in 2012/2013).
With scale and culture giving rise to lower unit costs, Progressive and GEICO can underprice peers, driving more policy volumes, more leverage on marketing spend, and more data with which to intelligently segment customers and price policies, further fueling better underwriting outcomes. The barriers to scale are formidable. Saying that competitor would need to spend gargantuan sums on marketing over decades to rival GEICO’s and Progressive’s market share doesn’t quite capture the difficulty because without legacy brand and underwriting advantages, its marketing dollars would be less efficiently spent.
Thus, while the US personal auto insurance industry has lost money on underwriting most years since at least 1970 (though it has made up the difference on float income)…
US Personal Auto Insurance Industry

…GEICO and Progressive have consistently generated underwriting profits:

Cost efficiency is an even more relevant advantage in the UK, where 70%-80% of new home and motor insurance is sold through price comparison websites (vs. just 25% in the US). With UK consumers accustomed to frequently shopping for the lowest price, a carrier cannot rest on the assumption that inertia will keep policyholders around from one year to the next: in a 2011 survey, Accenture observed a “step change” in attrition levels, with 68% of auto policyholders reporting having been with their auto insurer for fewer than 3 years. With price comparison shopping so prevalent, retaining customers depends on consistently appearing among the first options on leading comparison engines, which in turn depends on offering the lowest price, which by implication means having the lowest cost structure.
Here’s how Admiral’s costs compare to the industry average:

Note that I am using Admiral’s “ultimate projected accident year loss ratio” above, meaning “as of 2015, here is what management thinks the loss ratio for policies underwritten 200X should be”. Given Admiral’s historical practice of setting conservative reserves initially and releasing those reserves in later years, the “ultimate projected accident year” loss ratios over the last ~3 years shown above are very likely overstate Admiral’s true loss costs (more on this later).
(Aside A few other things to keep in mind:
First, as you can see I don’t have market level data extending past 2016. But according to E&Y, the UK motor insurance industry has only produced underwriting profits in 5 of the last 33 years through 2018.
Second, the market data comes from management, who pulls the market ratios from disclosures provided by carriers to the UK’s Prudential Regulation Authority. I don’t know which carriers comprise “the market” and there may be Home/Auto mix differences that confound comparisons between Admiral UK (which is ~entirely auto) and the selected peer group. But Direct Line – the 2rd largest auto underwriter in the market, with 14% share vs. ~18% for Admiral – produces far higher combineds in its Auto segment than in its Home segment (an average of 102% vs. 91% from 2010 to 2019)…so to the extent Direct Line’s underwriting experience maps to the UK personal lines market as a whole, then Admiral’s relative outperformance would be even more impressive.)
Here’s Admiral’s reported calendar year loss, expense, and combined ratios from 2002 to 2019:

The above chart shows reported calendar year loss ratios – reserve experiences for policies underwritten across all accident years for a particular calendar year – and includes modest losses on insurance operations outside the UK. Admiral’s underwriting margins have been come above those of Direct Line Motor and personal auto peer Hastings (8% market share) year after year. Only Sabre (2% share) has produced better underwriting profits since 2012.
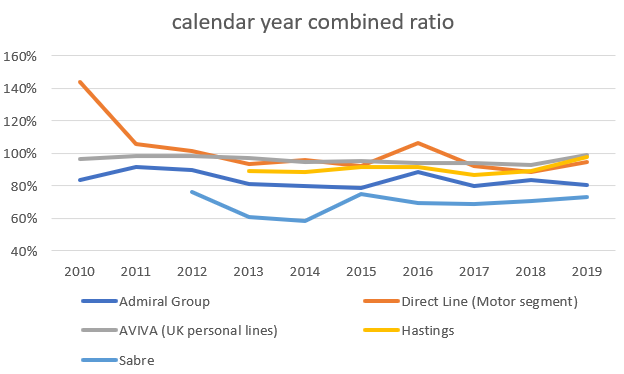
[Note: in the above chart, I am using reported calendar year loss ratios vs. the accident year loss ratios for the market comparison charts from earlier. Also, prior to 2015, I compute Sabre’s combined ratio from statutory reports filed with the PRA]
Sabre is a bit player that distributes primarily through brokers and tends to attract higher premium customers. As a matter of policy, it conservatively prices for 70%-80% combineds and lets volumes fall where they may. But Sabre may be conservative to a fault, too narrowly obsessed with underwriting profit margins rather than profit dollars.
Over the last 20 years its combined ratio has averaged just 72%, unheard of in this industry – most auto insurers have trouble reporting loss ratios of 70%! – and lower than Admiral’s low-80s. However, its low-20s expense ratio is much worse than Admiral’s, which means it produces prodigious underwriting margins by limiting its loss ratios, i.e. being very selective, perhaps too selective, about its risks.
But this singular obsession with reporting impressive loss ratios is bad for growth. Sabre was founded in 1982 – it traded hands several times before being MBO’ed in 2002 – and underwrites less than £200mn in gross premiums today. Admiral was founded a decade after Sabre and has grown to more than £2bn of annual premiums, organically. Over the last 4 years, Sabre has grown gross premiums by just 2%/year compared to Admiral UK Motor segment’s 9%/year.
So while Sabre has reported better underwriting margins than Admiral, it has created way less value. So long as the strategy is to optimize underwriting margins, Sabre will always be relegated to niche low-risk high-dollar policies and does not represent a threat to a mass market player like Admiral, imo.
Another interesting competitive development to keep in mind is that in 2019, Allianz Holdings paid £619mn to acquire the 49% of LV General Insurance Group that it didn’t already own45. I estimate LVGI has ~8% of the UK auto market. It was a significant division of a mid-sized UK Life and PC conglomerate, LV=, and is now a pimple on a massive German conglomerate. Allianz has operations in life insurance, P&C, and asset management across Europe, Latin America, Asia, and the Middle East. Its P&C division generates €60bn of premiums vs. LVGI’s ~€1bn. There are fears that Allianz will use its balance sheet to muscle out other UK underwriters. According to one analyst, in some of its business lines Allianz runs expense ratios as low as 10%…but I have a hard time imagining that such impressive expense ratios apply to huge, competitive markets like auto insurance. When it was part of LV=, LVGI’s combined ratios were ~94%. Likewise, Allianz’s P&C division as a whole underwrites to 94%-95% pretty consistently. Both companies have expense ratios well above Admiral (28% for Allianz and 25% for LVGI vs. 16% for Admiral). I see no reason to suspect that LVGI will suddenly become cost competitive with Admiral now that it is part of Allianz.
In short, not only has Admiral underwritten profitably every year going back to at least the early 2000s, but it has consistently generated combined ratios well below the industry and most of its closest peers.
When it was founded in 1999 by the colorful Henry Engelhardt – who led the management buyout of the company before taking it public in 2004 and running it as CEO until 2015 – Admiral was surrounded by woefully inefficient legacy carriers. The sprightly upstart differentiated through incentives and execution, doling out shares to all employees, 90% of whom stayed with the company from one year to the next; settling claims much faster than peers, thus creating more loyalty among customers, 95% of whom claimed an “intention to renew after a claim”; and taking advantage of its lean cost structure to offer more competitive rates. It instilled a culture of underwriting discipline. When pricing collapsed by 25% from 2012 to 2014, Admiral refused to trade profitability for volume. Following a 5-year stretch from 2006 to 2011, when it grew insured vehicles by 19%/year, Admiral kept policies flat over the next two years, enduring a 17% decline in premiums as a result. But it remained solidly profitable while the industry endured significant losses and when rates recovered, Admiral was one of the few insurers who didn’t have to shock its customers with alarming price hikes to make up for prior years’ losses.
But going from startup to the largest and most profitable underwriter in a highly competitive sector over the span of just 2 decades required more than solid execution. Though the incumbents were not as thoughtful about incentives and culture and customer experience, because they had been around for a long time and could bundle across auto and home insurance, they were nonetheless very well represented by the independent agents who controlled access to policyholders. So how did this lean startup with no distribution compete? By introducing as much price transparency into the market as possible.
Knowing that its low cost position would enable it to offer the best prices, Admiral pioneered online price comparison (PC) shopping for the UK auto insurance market in 2002 (just as the consumer internet was just taking off) with the launch of confused.com. Admiral used PC shopping to shoehorn its way into this sleepy, inefficient market, growing its share of auto policies from ~3% to ~20% from 2004 to 2019, coincident with the rise of PC sites – which went from intermediating less than 20% of new policies to over 70% – as the dominant distribution channel.
Moreover, Admiral has achieved this growth in a very capital efficient manner.
Those of you who are familiar with insurance companies will notice right away that Admiral’s income statement looks very different from that of a typical insurer, which latter obtains substantially all of its income from underwriting and float, like this:

By contrast, here’s Admiral Group:
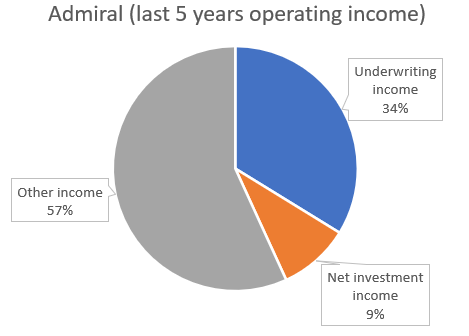
Underwriting and investment income make up 85% of Progressive’s income vs. just 43% for Admiral. Most of the Admiral’s profits come from “other income”, which consists of:

Over the last 5 years, Admiral has generated more of its cumulative income from ancillary profits ($760mn) than it has from underwriting ($710mn). Net investment income, at just $197mn, is only the 5th largest contributor to Ancillary’s profits.
Ancillary profits include fees for products that complement core auto insurance like breakdown, personal injury, and car hire covers, as well as cancellation fees and referral fees for insurance not written by Admiral. It’s very high margin stuff.
Installment income is interest charged to customers paying for coverage in installments.
Price comparison sites we talked about.
Profit commission gets at another interesting part of Admiral’s business model. Unlike most primary insurers who retain most of the risk they underwrite, Admiral cedes close to 80% of its UK auto premiums to reinsurers and receives a commission from those reinsurers based on the underwriting profits of the ceded risk. Given how much its book is offloaded, Admiral might be more appropriately thought of as a franchisor that rents out its cost advantage and collects stable recurring commission fees from reinsurers as compensation. Or maybe as a lender who securitizes its loans and retains the servicing rights. Or maybe….ok enough with the contrived framing (“Costco is a subscription business that just happens to loss lead with merchandise!” “Dominos is really a tech-enabled logistics companies that just happens to sell pizzas!”)
In some cases, where a company derives profit can be symptomatic of a moat. For instance, I would rather own an insurer that gets more of its income from consistently profitable underwriting (like Progressive) than an insurer that gets most of its income from float….the reason being that so few insurers manage to underwrite profitably every year that doing so indicates a hard-to-replicate advantage, whereas anyone can look smart for a while by gearing up a bond portfolio or migrating risk further out the curve. Of course, the insurer may have an investment edge, but that’s really hard to verify.
But in other cases, profit streams are more or less fungible. Robin Hood derives relatively more of its income selling order flow than Charles Schwab, which makes most of its money betting on the yield curve. You might argue that Robinhood delivers a user experience that old man Schwab is too culturally stultified to replicate. This may or may not be correct, but it is at least valid, i.e. it could be the basis of a competitive advantage that drives superior scale over time, at least for a certain customer segment. But you would never say something like “Robinhood’s advantage over Charles Schwab is that it gets more of its revenue from order flow vs. rates” or vice-versa because neither Robinhood nor Schwab have privileged access to those revenue streams. If the yield curve ever became untenably flat for Schwab (the lowest cost, most scaled broker in the industry), it might move to a fee-based model or something. The point is that when it comes to commodity products where price is among the dominant considerations, the player with the lowest unit costs will be in the best position to charge the lowest prices, which latter can be instantiated through any number of revenue models.
That’s not to say revenue models don’t matter. If Google licensed its technology to other search engines instead of monetizing the technology itself through ads, the company may not have evolved into the powerhouse that it is today. The right revenue model, when paired with some critical advantage, can reinforce scale (as it does in Google’s case). But a recurring, capital light etc. isn’t in itself the source of sustainable differentiation. A revenue model is not the same thing as a moat.
Because Admiral offloads 80% of its business to reinsurers and gets most of its revenue from commissions and ancillary fees that don’t require capital, it can report 50%+ returns on equity vs 20%+ for a superbly managed primary like Progressive, who retains nearly all its premiums. But it would be erroneous to therefore conclude that Admiral’s revenue model is the root source of value creation because the ability to recognize such robust and consistent capital-lite income streams in the first place is a function of underwriting profits enabled by an advantaged cost position. For instance, in 2007 and 2010, Admiral wielded its underwriting performance to negotiate more favorable profit splits with reinsurer Munich Re. And Admiral would not attract the customer volumes nor have the price cushion to enjoy growing ancillaries if its auto policies were priced higher than peer’s.
One might express skepticism about Admiral’s revenue model, cautioning that the UK government – which has in the past intervened on matters of claims compensation and pricing practices – might also crack down on unorthodox sources of income. But my impression is that ancillary services are a significant income source for all UK P&C insurers – Direct Line gets ~1/3 of its operating profits outside of underwriting and investments; Hastings derives 40% of its total revenue from “other revenue” – and that if those services were regulated out of existence (not that this is on the table, I’m just speculating), the industry, which can’t even turn an underwriting profit most years, would be in huge trouble. Admiral, with its 15% underwriting margins, would not only survive but pick up share from its struggling peers.
If you are familiar with US auto insurers, one of the other somewhat unusual things you’ll notice about Admiral and other UK insurers is that they release a significant amount of prior year reserves into earnings every year.
Let me explain what that means.
At the time an insurer unwrites a policy, it makes an initial estimate of the losses it expects to incur on that policy and sets aside reserves to cover those losses. That initial estimate may be adjusted up or down based on how the policy develops – if the original reserve estimate appear insufficient to cover the policy’s losses, the insurer will add to its reserves; if reserves are more than sufficient, it will “release” redundant reserves back into earnings.
For instance, check out the red line in the exhibit below, which shows that for the policies that it underwrote in 2015, Admiral set reserves implying a loss ratio of ~80%-85% in year 1. As the 2015 vintage aged, it became more evident that the actual loss ratio on that book of business was lower than originally anticipated: in year 2, management lowered its loss ratio estimate for the 2015 accident down to ~75%; by year 6, it was revised down to 70%. These excess reserves on past accident years are released into current year earnings. Admiral’s earnings for calendar year 2017 (2 years after the 2015 vintage was underwritten) would be boosted by downward revisions in vintage 2015’s reserves from Year 1 to Year 2.

And for Admiral, these reserve releases are huge, averaging ~17% of net premiums since 2008. Without these releases, Admiral would report significant underwriting losses most years.
Many investors hate this. They see reserve releases as a low-quality source of earnings. But context is everything. For an insurer with a long history adverse reserve development (i.e. initial loss picks that persistently underestimate ultimate losses), you probably don’t want to capitalize earnings padded by a one-time windfall of reserve releases. But for a conservative underwriter like Admiral that consistently sets initial reserves way above where they need to be, backing out releases is just as bad. Maybe you get lucky and set an initial loss pick of 70% when the ultimate loss ratio, in fact, turns out to be 70%. Or maybe you suspect the ultimate loss ratio to be 70% but you conservatively set initial reserves at 85% and release your way down to 70% over the next few years. In either case, the normalized earnings you’re trying to get to should reflect the true loss ratio of 70%.
The most compelling counterargument to this is that over-reserving can be exploited by unscrupulous management teams to surreptitiously pad earnings under the pretext of conservatism (excess reserves in strong underwriting years are released in later, crappier years). But this strikes me as more of a quality-of-management than a quality-of-earnings issue. For the most accurate depiction of Admiral’s earnings power, one should include reserve releases.
After Admiral proved it could pair a culture of low-cost and disciplined underwriting with the transparency of the web to gain dominant market share in the UK, it tried replicating the same approach in other countries. Below is a list of Admiral’s various international endeavors.

[Besides the above, Admiral also had a German carrier (Admiral Direkt), which lost money for 3 years before finally being sold in 2010. The market looked superficially promising – it was about the same size as the UK at the time (~€14bn gross premiums) and direct players had just 10% of the market – but ultimately the conservative German consumer proved unwilling to defect from the small cadre of highly profitable incumbents6. Admiral also had a price comparison site in Italy (Chiarezza), which was also sold in 2010.]
When considered as a standalone profit center, Admiral’s Comparison segment – the segment that operates Admiral’s price comparison websites – looks mediocre. These aggregation sites don’t enjoy the generic two-sided network effects one might expect because in each European country there are only a handful of insurers with the scale to offer competitive prices. It’s hard to claim “aggregator” economics when upstream the value chain there are only like 4 suppliers that matter and securing participation from each one is necessary for your site to be viable. Spotify, who relies on 3 record labels for most of its streamed music hours, is a different case because iterative procurement, user-generated playlists, and the habitual nature of music consumption foster demand side captivity that might be transformed into favorable economics, somehow, someday. A lead gen site like LendingTree or Confused.com that a consumer visits maybe a few times/year does not enjoy these benefits. I wrote about the dilemma in a Trivago post from November 2017:
“At least TripAdvisor can claim authentic and current user-generated reviews. Google began with a superior mousetrap and didn’t need to spend gobs on advertising to attract users (plus, because general search is so frequently used, it is habit-forming in a way that travel-specific search is not). Trivago’s vertical search has, well…what exactly…to keep users continuously coming back once they have clicked off the site?…
This is why I find I Trivago’s competitive positioning so precarious: it doesn’t possess the bargaining power to procure traffic at advantaged cost nor an irreplicable process to transform that traffic into value so compelling and unique that even their powerful customers will cede economic ground.”
Admiral’s confused.com launched in 2002 as the first PC site in the market and claimed 65% market share over the next 3-4 years. But management never deluded itself into thinking that confused.com could maintain dominance, predicting as early as 2006 that the site would cede share as its success attracted competition. And sure enough, by 2010 Confused’s share decayed to just 25%. Revenue has compounded by ~5% since 2008 but operating profits have declined from £26mn to £20mn during this time as Confused has had to aggressively reinvest incremental revenue in marketing to stay relevant in the face of fierce competition. Admiral’s PC sites in France and Spain command leading market share7, but they contribute a meager £5mn of operating profits. In the US, Admiral’s compare.com continues to lose money 6 years after launch.
So while Admiral’s O&O price comparison sites are strategically important, they don’t make much money. And that is fine. Admiral runs PC sites to promote comparison shopping behavior for the benefit of its direct insurance operations; its direct insurance operations, in turn, serve as the first best customer for its PC sites in markets where the entrenched incumbents are unwilling to participate. Confused.com has been “meh” as a profit center, but what matters is that the site ignited a new acquisition channel in the market and habituated UK consumers into comparison shopping for insurance, playing to Admiral’s cost advantages.

In other words, price comparison sites are the commoditized complement to insurance operations that enjoy massive scale advantages….or at least that’s true in the UK.
In other European countries things are less clear, though one can certainly understand why Admiral chose to plant new flags.
First, the market opportunity in each country is significant:

Second, unlike the UK, which has transitioned to direct channels and where new sales are dominated by price comparison sites, auto policies in Spain, Italy, and France are still predominantly distributed through “traditional” channels (third party brokers and banks) and the proportion of new business sourced through aggregators (aka price comparison sites) is still low relative to the UK:

In each of these markets Admiral operates as a “Direct” underwriter, which by management’s definition means that it doesn’t lean on traditional third-party agencies and banks (so, insurers who source their customers through price comparison websites are still considered “direct”).
The Direct segment of the market, while small, has been gaining share in Spain and Italy:

And Admiral’s share of the direct market is small – 6% in Spain8, 9% in Italy9, and 10% in France10 compared to 20% in the UK – but growing, which makes for a nice story about Admiral taking share within a category that is itself taking share.
That Admiral has grown at all in continental Europe over the last 6 years let alone by 18%/annum is impressive given the flat/declining average premium trends in its markets:

And while Admiral is breaking even in Spain and losing money in France – reporting loss ratios higher or no better than the industry – I suspect most of this is due to growth-related mix issues: when you’re growing so much faster than the market, relatively more of your installed base will be made up of year-1 customers who haven’t yet had time to season. Management claims that when you adjust for the mix of new business vs. renewals, L’olivier’s loss ratio is in line with the industry and Seguros is 3 to 5 points lower. So then when you consider that L’olivier and Seguros have scaled their expense ratios – which have gone from 69% in 2013 to 38% in 1h18 (the last period disclosed) for the former; from 51% to 35% for the latter – perhaps there is good reason to think that these operations are or soon will be structurally profitable.
The US is a different story. Elephant and the complementary US price comparison site, compare.com, are losing as much money today as they did in 2013. While the US auto market is enormous – its €200bn+ of gross premiums more than 3x greater than UK, France, Italy, and Spain combined – I am skeptical about Admiral’s prospects here because: 1/ by the time Admiral launched Elephant in 2009, the direct market was already consolidating around incumbents GEICO and Progressive, who had established enormous scale advantages as previously discussed; and 2/ those direct incumbents have blasted consumers with effective marketing campaigns for decades, effectively crowding out the disintermediating influence of PC sites/aggregators. After realizing that Germany would be more difficult to win over than expected, Admiral cut its losses and abandoned the market after 3 years. And yet in the US, after a decade of losses, the company seems reluctant to forsake its pursuit. I don’t get it.
But ok, looking past the US, how good can things get?
Across Europe, Admiral’s profit per policy turned positive in 1h18 and has been trending the right way since.

In 2019, Admiral generated €9mn of underwriting profits in Europe, barely a dent in the company’s current €530mn of operating profits. But it’s not hard to imagine a scenario where Europe starts to matter.
In Admiral’s largest European market, France, the share of gross premiums claimed by direct underwriters barely budged in the 17 years from 2000 to 2017, moving from just 2% to 3%. Let’s say that Direct share stays at 3% over the next 7 years but that L’olivier grows its share of Direct from 10% to 20%. In Spain and Italy, let’s imagine that Direct share grows to 20% (up from just 10%-12% but still well below the UK’s 50%) and that Admiral’s share of Direct in each of those markets rises to 15% (up from high-single digits). This implies a 13% CAGR in gross premiums over the next 7 years, which seems reasonable to me (by comparison, Admiral Europe’s premiums have CAGR’ed by 18% over the last 6 years).
After ceding 70% of premiums, assuming an 80% combined ratio (which means Admiral would earn profit shares with reinsurers), and including ancillary income, investment income, and installment fees proportional to the premiums that Admiral generates in the UK, you can get to ~£120mn of European operating profits vs. today’s total pre-tax profits of £530mn.
The core UK auto market is experiencing claims inflation challenges and regulatory uncertainty, but nothing that worries me too much. Everyone is passing high-single digit claims inflation through price. Regulation is trickier – sometimes regulation has a negative effect (regulators cracking down on “loyalty penalties” in which insurers draw consumers in with discounted pricing and raise prices in subsequent years); sometimes it has an ambiguous effect (whiplash reforms that make it more difficult for consumers to report exaggerated injury claims); and sometimes it introduces temporary earnings volatility (Odgen discount rate…Google it or read this article) – but so far it seems these measures have been flushed through the numbers with no lasting competitive impact. COVID also obviously introduces many unknowns (will lower claims frequency be offset by higher claims severity due to the limited supply of replacement parts? Do financially struggling consumers stop paying premiums or stretch for greater claims reimbursement?).
And then there’s the long-term existential risk of autonomous vehicle. I don’t know what consensus opinion is on this matter, but it seems most folks think (myself included) think autonomous vehicles will be technically feasible at some point…the debate is a matter of when and to what degree. Based on my limited understanding, there are still significant technical hurdles before we get to a Level 5 AV that can anticipate 99% of edge cases in unkind environments (I believe Stuart Russell has talked about how altering even a few pixels can throw off algos in incredibly baffling ways that are not really understood); challenges around regulatory approval and consumer behavior are also big unknowns. We don’t even know if AVs will be ultimately be sold to consumers or to large fleet owners who rent them to consumers.
I try to keep up with what’s going on – I probably listen to the same podcasts, read the same blog posts and articles, and hear the same management commentary as everyone else interested in this space – but the truth is that as an outsider, I don’t know what I don’t know when it comes to the technology and state of regulation. It “feels” to me that the figuring out the last 5%-10% of edge cases has proven more difficult than expected, but I don’t really know. Having said that, I would naively put the probability that Level 5 AVs comprise half of new vehicle sales in 10 years at 30%. In 20 years, I might say it’s more like 60%. In a scenario where AVs comprise half of new car sales, we’re talking maybe, what, 10mn cars against a car parc of 300mn? Now, that may seem small, but I imagine the positive knock-on effects of incredibly precise “error-proof” AVs on accident frequency will be non-linear and surprising.
Perhaps the right question is not “when?” but “where?”. I can imagine pockets of high self-driving penetration in relatively easy environments and low levels of penetration elsewhere….a spectrum of different outcomes. I don’t think AVs will be an asteroid strike that annihilates car insurers, suppliers, salvage companies, and the rest of the ICE value chain without warning. Adoption will densify in kind environments before spreading to unkind environments. Consumer adoption and regulatory guardrails will shimmer into view and one can update probabilities accordingly. Moreover, it’s hardly a given that Admiral simply ceases to exist in a world of widespread AV adoption…maybe it becomes a category leader in IoT insurance or pivots to home insurance…who the hell knows.
Even if you believe autonomous driving will arrive at some point, avoiding Admiral, Progressive, Copart, Carvana, Carmax, etc because of AV concerns can seem sort of like avoiding mall-based specialty retail stocks in 1994 because you were worried about Amazon and E-Bay. You didn’t need to be a starry-eyed futurist to believe that e-commerce could be a thing in 25 years. And you would have been right. Eventually. But in 1994, there were so many questions around payments, logistics, consumer behavior, and regulation that eschewing retail stocks would have been premature for many years.
But as a subscriber correctly opined, by the time e-commerce hit ~5%-10% of US retail sales, many investors were already declaring traditional retail defunct. The market is forward looking and if AVs ever penetrated 5% of the car parc, investors would start to ascribe impaired terminal values to anything tied to traditional autos.
How far do you take this? If you believe that technology will resolve today’s obvious frictions at some unknowable point in the far future, thereby annihilating the terminal value of every company that profits from those frictions today, what can you own? How early is too early to avoid certain stocks that you are reasonably sure will be gravely impacted by technology? If you believe that blockchain will eventually overcome legacy institutional impediments that no one would design into a system from first principles today, can you still own Broadridge or title insurers (see my prior posts “Title Insurance, Ownership, and Blockchain” and “Broadridge and blockchain” post for more)? Or do you just ignore price and own companies that are on the right side of all the sexy trends, run by managers who can adapt to whatever the future holds?
Notwithstanding these uncertainties, I suspect that the basic structure and competitive composition UK auto insurance does not look materially different in 7 years (though as always, I stand ready and willing to change my mind). A scale-based cost advantage will continue to be primary lever for relative value creation in a market intermediated by price comparison sites. So I’m thinking that UK profits grow by maybe 5%/year to £840mn in year 7. Adding £120mn from Europe, zeroing out the US and price comparison, assuming some growth in corporate overhead, putting a 15 multiple on year-7 earnings (vs. 16x today) and summing up the dividends from now to then (Admiral pays nearly all its earnings out as dividends every year), and you’re compounding at maybe ~11% from the current price (£23).
Disclosure: At the time this report was posted, Forage Capital did not own shares of Admiral, PGR, or Berkshire Hathaway. This may have changed at any time since.
As I wrote in my Protector Forsikring post: “The problem with long-tail business is that the sins of the past are always lurking in the background. The reserve deterioration you see today could tie back to risk underwritten 5-10+ years ago. Based on my experience covering insurers, when a carrier takes a reserve hit on a long tail liability (like, say, worker’s comp or asbestos), there is almost always another shoe to drop. Loss events related to short tail lines, on the other hand, resolve themselves quickly. When a hurricane rips your house apart, trust me, you will know and you won’t wait 5 years to report the event to your underwriter”.
Exhibit

Management once referred to driving behavior as the “single most predictive rating variable”.
The first 49% was purchased in December 2017 for £500mn
Allianz also purchased the General Insurance division of Legal & General the same year, but this division doesn’t underwrite auto
According to data from Statista, the combined ratio for Motor insurers in 2014/2015/2016/2017/2018 was 67%/74%/84%/54%/57%
As of 2017, in Spain Rastreator.com has 65% share vs. 30% and 5% for competitors Acierto and Kelisto; in France, LeLynx.fr commands 40% share vs. 40% and 10% for Les Furets and MeilleurTaux.
In Spain, regulatory changes resulted in escalating claims costs that in 2015 led to widespread industry losses. Some insurers raised prices but not enough to provoke the widespread price comparison shopping that would have advantaged Admiral, so the company recently started diversifying its policy acquisition channels to include brokers. While Admiral Seguros continues to grow at a healthy pace (16% in 2019 following 10% growth in 2018), after more than a decade since launching, the insurer is still just ~breaking even.
In Italy, Admiral’s largest market outside the UK, incumbents have been slashing prices to chase volumes since 2014. After staying disciplined and seeing its revenue contract in 2015, I guess Admiral realized that the scale economies from growth more than offset any deterioration in unit economics from price concessions, because despite market rates continuing to fall by low-single digits in the years that followed, Admiral grew its customer base at a rapid clip (premiums have increased by 2.5x from 2015 to 2019), keeping its prices low enough to lead the competition on PC sites, but not so low that it lost money. 2019 marked Admiral’s 6th consecutive profitable year in Italy.
In France, L’olivier has been growing revenue at a torrid pace, from $13mn in 2013 to $108mn in 2019, assisted in part by a 2014 law that made it easier for French consumers to switch auto carriers. Auto insurers in France have reported 100%+ combined ratios every year since at least 2012 and L’olivier is no exception.