

[SPGI, MCO] Market infrastructure: part 2

Banks, regulators, and fixed income investors rely on Moody’s and S&P to provide a consistent and standardized metric of credit risk across names and over time. As I explained in The Self-Reinforcing Standards Moat:
…ratings underpin the risk weightings that banks attach to assets to determine capital requirements, dictate which securities a money market fund can own, and, in ostensibly surfacing the credit risk embedded in fixed income securities, make it easier for two parties to confidently price and trade, enhancing market liquidity.
Because of such industry-wide adoption, a debt issuer has little choice but to pay Moody’s for a rating if it hopes to get a fair deal in the market: an issuer of $500mn in 10-year bonds might pay the company 6bps ($300k) upfront, but will save 30bps in interest expense every year ($15mn over the life of the bond)….and each incremental issuer who pays the toll only further reinforces the Moody’s ratings as the standard upon which to coalesce, fostering still further participation. This feedback loop naturally evolves into a deeply entrenched oligopoly.
A similar standards moat applies to FICO….
Like a Moody’s rating, the FICO credit score’s ubiquity reinforces adoption: it wouldn’t make sense for a bank to suddenly adopt an alternative, less widely used credit score (even if that score were equivalently predictive) given how hard it would be to reconcile the new rubric with the FICO Score that is already woven into its risk management process and being used to tag, price, and otherwise evaluate millions of borrowers already in its system (according to management, at least one bank has FICO Scores embedded in 67 mission critical applications). The FICO Score is the industry standard for seeing how one borrower’s creditworthiness has trended over time and for comparing one borrower’s creditworthiness to another’s.
Likewise, the utility of equity indices like the Russell 2000, FTSE 100, S&P 500, and The Dow Jones, is derived from consensus rather than from absolute standards of reasonableness. The Dow Jones Index methodology, which weights its 30 constituents by share price, is routinely mocked as non-sensical, but its absurdity is more feature than bug as it suggests that a more sensible index couldn’t just come along and displace it the same way that a better technology might, in theory, replace entrenched network effects.
And once this IP is embedded in the asset management edifice, it is monetized primarily in the form of subscription revenue and fees tied to the AUM of ETFs that reference that IP.
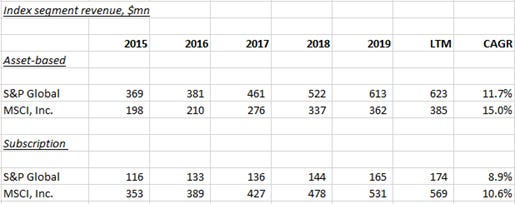
Besides asset-based and subscription revenue, S&P Global’s Indices segment, a joint venture 27% owned by CME Group1, also derives revenue from royalties pegged to exchange trading activity of derivative contracts linked to S&P and Dow Jones’ indices. Compared to S&P, MSCI2 doesn’t monetize as well through trading volumes of derivative contracts, though this is an area of growing focus for management.
That ETFs will account for a growing share of institutional assets seems like a safe prediction. ETFs can be traded throughout the day and even sold short to manage risk; are generally more tax efficient than mutual funds, which pass on the capital gains taxes of trading activity to investors; and don’t bear the administrative burden of customer support and communications, which translates into lower expenses for investors. In short, ETFs offer the same exposure to styles, industries, geographies, etc. as a mutual fund, but for lower fees and with the liquidity and efficiency of an exchange-traded security.
It is little wonder that they have attracted so much interest:
Assets managed by ETFs

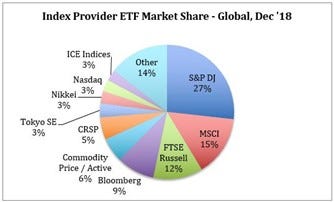
Over half of ETF assets reference indices from just 3 providers, with S&P Dow Jones claiming the largest share at the end of 2018:
The attributes that make ETFs so attractive in equities apply to fixed income. Fixed income ETFs are earlier on the adoption curve – its $1tn of assets accounting for just 1.5% of the total investable fixed income universe3 compared to equity ETFs making up ~8% of global equity market cap4 5 – but adoption is growing.